I wrote this article for Institutional Investor magazine. I feel very passionate about the topic and thus could not compress all my thoughts into the 800-word limit. I expanded the article, and it was published in John Mauldin’s Outside the Box newsletter. “Expand” is an understatement as it is four times the length of the original article. I suggest you skip John’s very flattering intro (he is too kind) and go right into “Are We There Yet?” It is very long. Kill a small forest – print it. Also, leave me your comments – I’d love to hear your thoughts.
Vitaliy Katsenelson is a modern-day American success story, the kind we need more of. He grew up in Murmansk, in the extreme northwest corner of Russia, north of the Arctic Circle and close to the Finnish border. He says he barely escaped a career in the engine rooms of Russian Navy vessels when his family wrangled a visa to emigrate to the US in 1991.
He finished high school here, knocked out a BA in finance at the University of Colorado at Denver, and followed up with an MS in finance and his CFA. At that point, a local Denver firm, Investment Management Associates, snapped him up; and before long he was one of the two principals in the company, alongside Michael Conn.
His first book, Active Value Investing: Making Money in Range-Bound Markets, appeared in 2007, and it proved Vitaliy had really been doing his homework: he had dug deep into the historical market data and emerged with insights that really broadened our understanding of range-bound or “sideways” markets (like the one we’ve been stuck in for more than a decade now). With the book, he also provided a very detailed strategic investment process for these very treacherous markets.
In today’s Outside the Box, Vitaliy brings those insights to bear on our present, tenuous situation, as we go on wondering what it is going to take to move the global economy off the (rapidly depreciating) dime and into a new, expansive phase. Vitaliy faces that question head-on, with a convincing combination of stock market analytics and global macro perspectives.
Vitaliy and I corresponded on this piece for some time. I often publish something in Outside the Box I don’t agree with, as I like to listen to those who disagree with me. In this case, however, Vitaliy and I do in large part agree, although there are some minor points on which I will have to engage with him the next time we get together. We are still in the secular bear market whose imminent appearance I was writing about way back in 1999. The end of the bearish slant will come when valuations are low. That can happen with a decline in price or a sideways market for a longer period of time. It makes for a challenging equity market. But time is the healer for secular bears, and this one too shall pass. There is yet another secular bull in our future. Until then we get trading opportunities and have to look for value where we can find it.

John Mauldin, Editor
Outside the Box
Are We There Yet?
By Vitaliy Katsenelson
I started writing my first book, Active Value Investing: Making Money in Range-Bound Markets, in 2005; finished it in 2007; and published the second, an abridged version of the first (The Little Book of Sideways Markets), in 2010. In both books I made the case that there is a very high probability that we are in the midst of a secular sideways market – a market that goes up and down, with a lot of cyclical volatility, but ends up going nowhere for a long time.
Sideways markets happen not because stock market gods play an unkind joke on gullible humans but because of human emotions. Historically, sideways markets have always followed secular bull markets. At the end of secular bull markets stocks become very expensive – their valuations (P/Es) get very high. Sideways markets are just a payback for all the fun and returns stock investors received during secular bull markets.
In 1999, after 17 years of incredible returns, the mother of all secular bull markets ended at valuations we’d never seen before. For this reason, in my first book I argued that the present sideways market, which started then, might last longer than past ones. In the Little Book I want a step farther with the benefit of hindsight – it was written post-Great Recession. I argued that the economic growth rate going forward will be lower than it was in the past, and thus this sideways market may even last longer than I originally suspected.
Every so often I get an email from a reader with the question, “Are we there yet?” Are we still in the grip of a treacherous sideways market, or we are now entering into a secular bull market? I will try to answer that question as best I can in this writeup.
The Sideways View of The World
In early May I had the pleasure of attending and speaking at the Value Investing Congress in Las Vegas. The last time I spoke there it was May 2008 and the market was just coming off its top. The S&P was at 18x trailing earnings. Profit margins were at a modern-day high. They subsequently collapsed but came back to set an even higher high.
The market was not cheap in 2008. It is not cheap now, either.
Before I dive into my argument I need to introduce you to a very simple calculation that is at the core of my sideways argument:
E + Change in P/E + Dividends = Total Return
Stock price movements are driven by two variables: earnings growth and changes in the price-to-earnings ratio. Add dividends, and you have total stock returns. The dividend yield of an average stock today is 2% – it is all yours to keep, so my discussion here will focus on the direction of “E” and “P/E.”
If you were to normalize profits for high margins and look at 10-year trailing earnings, in 2008 stocks were trading 66% above their historical average. They were at 30 times 10-year trailing earnings (see next chart).
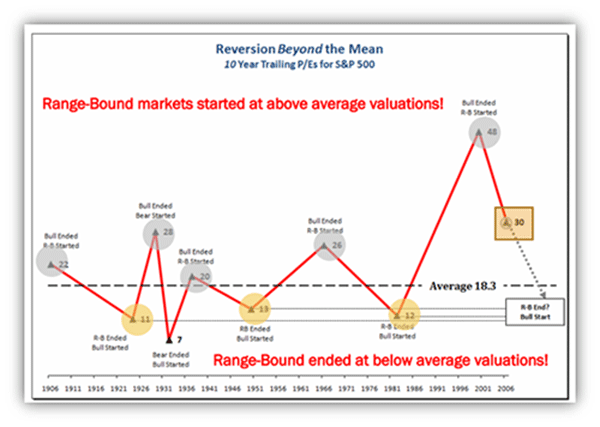
In all honesty, I could make the same presentation today as I did five years ago (in fact I borrowed and updated a few slides from that presentation – see next chart). Market valuation is not dramatically different now from what it was then. A cyclical bear and a cyclical bull market later, the S&P 500 is still at the same 18 times trailing earnings and 26 times 10-year trailing P/E, or 41% above average. (It was 60% above average in 2008.)
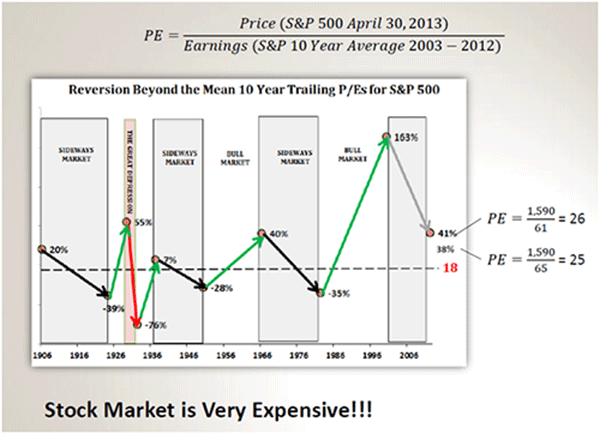
(See footnote at end for a detailed explanation of the above chart.)
Investors who were on the sidelines over the last few years and who are now pouring money into stocks, expecting that we are in the midst of a secular bull market, will likely be disappointed.
The previous sideways market of 1966-1982 had four cyclical bull markets and five cyclical bear markets packed inside it. From 1970 to 1973 the Dow went from 700 to 1,000, just to drop again, this time to 600. Four times, investors thought that a cyclical bull market had turned into a secular (long-term, 1982-1999 type of ) bull market, but their hopes were dashed as they discovered that these were just head fakes toward the next cyclical bear market (see next chart).
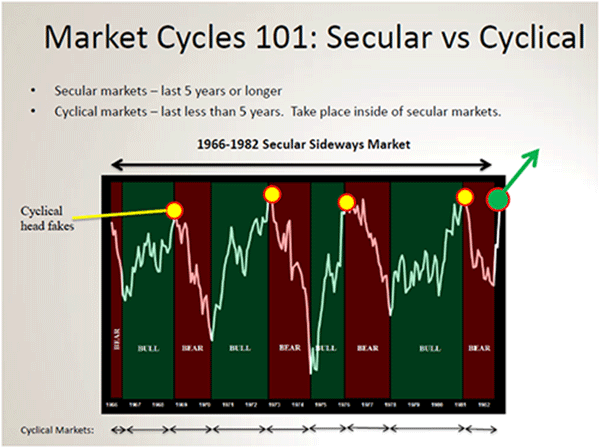
It is when nobody wants to own stocks ever again, when valuations are below their historical average, that a secular sideways market finally dies (actually more like goes into hibernation) and the next secular bull market is born.
But even that is not enough: stocks need to spend some time at below-average valuations. In the 1966-1982 secular sideways market, stocks spent half their time at below-average valuations. During the recent crisis we tiptoed into below-average valuations, but we danced right back out. Sideways markets are there to destroy hope and tarnish memories of the last secular bull market.
If you believe we are in the midst of a secular bull market, you have to be very comfortable with three things:
First, profit margins. Today, corporate profit margins are hitting all-time highs.
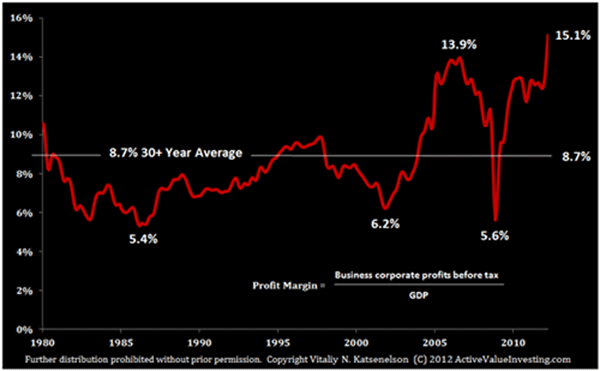
Historically, profit margins have been very mean-reverting – high margins were never sustained by corporations over a prolonged period of time because, as Jeremy Grantham puts it, “capitalism works.” When a company, Apple for example, starts earning very high margins, its competitors (like Samsung) come in and try to undercut it with lower prices. In response, Apple must lower its margins or dispense with a lot more features in its products.
If margins decline even as the economy grows, earnings growth will be very benign or negative. Suddenly, stocks that were seemingly cheap will not be cheap any longer.
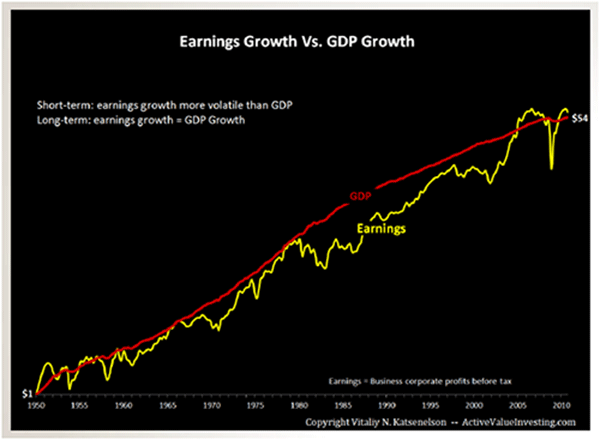
Since we’re on the subject, let me dispel the myth that earnings can grow at a faster rate than the economy for prolonged period of time – they cannot and they have not. For this to happen profit margins would have to continuously expand, and as we have discussed above, they don’t.
But don’t just take my word for it. In the chart below I’ve plotted corporate earnings (yellow line) against GDP (red line) from 1957 to 2011. There were periods of time when earnings grew at a faster rate than GDP (profit margins expanded), and then they werealways followed by periods of time when earnings lagged GDP (profit margins contracted). But in the long run earnings growth equaled GDP growth.
To be fair to the “earnings bulls,” earnings per share can outpace both earnings growth and GDP in the long run through share buybacks. When corporations repurchase their own shares the earnings pie is divided among fewer investors, and thus earnings per share will rise at a faster rate than net income. Share buybacks helped the S&P 500 to accelerated earnings per share growth by about 3% a year over the last two years.
Management can create enormous value for shareholders through smart capital allocation (share repurchases and issuance – and, at the right time, dividends and acquisitions). Henry Singleton at Teledyne created one of the most successful companies in the second half of the last century by being a very smart capital allocator.
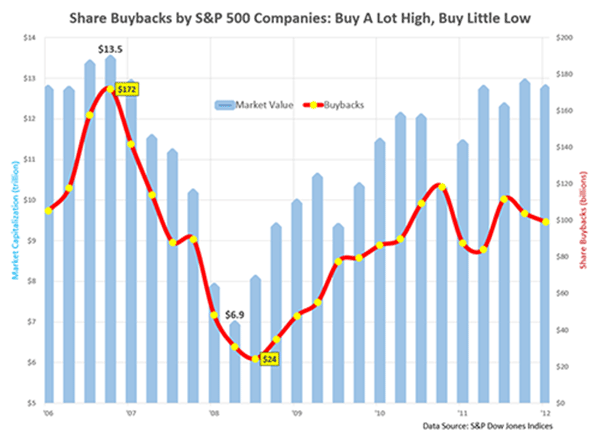
Unfortunately, in general, corporations have not been good capital allocators; they’ve been buying their stock back high rather than buying (or issuing) it low. In the third quarter of 2007, S&P 500 companies spent $172 billion on buying their own stock – and of course that marked the highest point for the stock market. Fast-forward a few years, and in the first quarter of 2009, when market capitalization of the index declined almost by half, their own stocks should have been unbelievable bargains for companies, right? Yet stock purchases by S&P 500 companies dwindled by 80% from their highs to only $31 billion. (See S&P report and chart below.)
Unlike dividends, which when reduced or cancelled may end up costing management their jobs and are thus very sticky, corporate buybacks are announced and often not followed through on, or are followed through at the wrong time. Don’t count on buybacks to be a significant accelerator of earnings per share growth in the long run.
Second, the global economy. Even if you are comfortable with high profit margins, you have to make an assumption that economic (revenue) growth will be robust going forward; and given how many headwinds we are facing from every corner of the globe, that is far from a given:
Europe. Massive QE has temporarily papered over the Eurozone’s problems, but the structural issues that gave rise to the current crisis have not been resolved.
China is in the midst of residential and commercial real estate and infrastructure bubble that is further supersized by a pile of bad debt that will make our subprime crisis seem insignificant. I’ve written a lot about China (link) and given a lengthy presentation about it (also covers Japan). Also, problems in China will not stay in China; they’ll spill over to the ABCs (Australia, Brazil, Canada – I think I just coined a new acronym), which are some of the biggest beneficiaries of China’s insatiable demand for commodities.
A side note: Command-control economies like China’s offer certain advantages over messy democracies in the short run (and only in the short run!). For instance, they can pull even a large economy out of recession very fast by forcing banks to lend and corporations to spend; and since property rights are just a minor inconvenience, they can build fast, too. But in the long run, especially once you add corruption into the mix, you have massive misallocation of capital (hence ghost towns) and a banking system that will be crippled once the bubble does what bubbles always do: bursts.
Japan, the most indebted developed country in the world, with debt-to-GDP over 211%, has been stuck in deflation for two decades. Despite its indebtedness, it is paying less on its 10-year bonds (0.86%) than Norway (2.17%), which has debt-to-GDP of 28%. Japan also has one of oldest populations in the world, a population that was a net saver and thus a buyer (financier) of Japanese government debt. Japanese seniors and financial institutions (which hold the bulk of the debt) are about to turn into net spenders and will be selling bonds. Therefore the government will have to either shop its debt outside of Japan and suddenly compete with the Norways of the world for investor capital (and pay skyrocketing interest expenses that will quickly burst its debt bubble), or it will print a lot of money and its central bank will become a connoisseur of its fine debt. So far it has chosen the latter course. Either scenario sets in motion its own ugly chain of consequences.
The US. Oh, our dear US. We are living through one of the most grandiose and untested lab experiments ever conducted by a central bank: QE Infinity. QE 1, which was implemented during the financial crisis, was an attempt by the Fed to prevent a run on the banks. It was the right thing to do, and the Fed did a brilliant job executing it. However, with QEs that followed the Fed has turned our economy into a Lance Armstrong economy. We’ve consumed so many performance-enhancing drugs in the form of endless QEs that it is hard to know how well the economy is really doing. Just as we don’t know whether Lance would have won seven Tour de France titles if it were not for steroids, we don’t know how our economy will fare when QE is withdrawn. Unfortunately, our Lance Armstrong economy will at some point have its Oprah Winfrey moment, when it will have to fess up.
It is very easy to be negative about the global macro picture, and the saying comes to mind here that “You’re not paranoid if they really are after you.”
All the aforementioned problems are very complex in isolation, but the complexity of analysis increases exponentially once you start thinking about how problems in one region impact another. For instance, the monster QE in Japan, which will make Bernanke look like an amateur (it is relatively much larger than his) is driving the yen down, a lot. This will make Japanese goods cheaper and more competitive against those of the Chinese and Koreans, et al. Will this be the final straw that pricks the bubble of the Chinese economy? Will it lead to currency wars? In all honesty, nobody knows. The unknowns remain unknown.
In fact, the great Charlie Munger comes to mind. At the Berkshire Hathaway annual meeting this year he said, “If you are not confused about the economy, you don’t understand it very well.” I am sure this applies not just to the US but to the global economy as well. This is not a prediction of global demise, not at all; but if you are betting on high or even average global growth going forward, you’re putting your money on a very low-probability scenario.
And finally, P/E expansion. If you are comfortable with high profit margins and global growth, you have to believe that P/Es can expand higher from this level. I have news for you: in the past, sideways markets started (bull markets ended) when valuations were at current levels. Secular bull markets start at low P/E levels, because prolonged P/E expansion is like a rocket booster that helps the rocket to overcome the gravity of the earth and sends it into stratosphere. Prolonged P/E expansion converts stock market nonbelievers into believers.
P/E compression is a very likely outcome from where we are today, and therefore markets will do what they did over the last thirteen years, go sideways with lots of cyclical volatility and no returns. In case P/E stagnates – a much lower-probability outcome, the market will very mildly appreciate.
What about QE and low interest rates? Could they take P/E to a new high?
The interest rate environment today is quite different than it was in the ’70s and ’80s. Then, during the last sideways market, interest rates were much, much higher. Stocks may deserve higher valuations than they did then; however, higher valuations would likely prove to be a short-lived phenomenon, since the direction of interest rates matters as much as their absolute level.
The Fed’s unprecedented intervention in the economy has increased the possible range and severity of negative outcomes, from runaway inflation to deflation or a freaky combination of the two (freakflation).
If the Fed succeeds and real growth resumes, this good news will be negated by rising interest rates. I know that the last five years have lowered our economic growth standards, and we’ll be excited if the global economy returns to average (unsteroided, thus sustainable) growth. However, normal economic growth in a rising interest-rate environment would not justify valuations much above average.
If interest rates remain at the present low level for a long time, it will mean we have a different problem: deflation (or freakflation) is not good for stocks or their valuations. Just look at Japan: over the last twenty years, stock valuations declined despite interest rates being at incredibly low levels. Expensive stocks (as I’ve mentioned, stocks in general are very expensive) discount earnings growth. If growth fails to materialize, these P/Es will decline.
So if you believe the future will bring average or even above-average economic growth and that interest rates will remain at this historic level, then I will be proven wrong.
Knowing what we know today, earnings growth for the next five to ten years is unlikely to be exciting and may not even be positive, and price-to-earnings is likely to change for the worse, not the better.
So what?
As I write this, one line from Charles Prince, infamous CEO of Citigroup, is stuck in my head: “As long as the music is playing, you’ve got to get up and dance.” That was Prince’s explanation for why Citi continued to originate loans even though risks were starting to outweigh returns, and when it should have been obvious to an astute observer that the situation would not end well. We know how that story played out.
Today investors are dancing because Fed is QEing. Right or wrong, the thinking is that as long as the Fed is QEing, stocks will keep going up. Everyone feels they can get out before the music stops –we heard this before, in the late ’90s. Few got out. “Dancing” is not investing, it is speculating. One of the problems with QE is that the Fed is forcing people to buy riskier investments than they otherwise would have. The immorality of their actions aside, they create a significant psychological mismatch between assets and their holders. Stocks are in weak hands, insuring one great stampede for the chairs when the music stops.
Despite how it may sound, I am not issuing a market timing call. I have no idea when this market will turn; nobody does, and if they tell you they do they are liars. Market timing is a loser’s game. It is impossible to put market timing into a repeatable process, because on top of getting a plethora of global events right you have to time human emotions.
When the market is making all-time highs it is easy to become complacent, let down your guard, and let euphoric media headlines go to your head. A joke that Warren Buffett told a long time ago comes to mind here:
A very successful oilman dies. He faces Saint Peter, who says, “You’ve been a good man, and normally I’d send you to heaven, but heaven is full. We only have a place for you in hell.” The oilman asks, “Any chance I could talk to other oilmen who are in heaven? Maybe I can convince someone to switch places with me.” Saint Peter says, “It’s never happened before, but sure, I don’t see any harm in it.” The oilman goes to heaven, finds an oilmen convention, and yells, “They found a huge, cheap oil discovery in hell!” So oilmen are stampeding out of heaven straight to hell, and our oilman is running with them; he’s leading the pack. Saint Peter shouts to him, “Why are you going to hell with them? I have a spot here in heaven for you now!” The oilman shouts back, “Are you kidding, what if it’s true?”
The moral of the story: don’t drink your own Kool-Aid. Don’t pour money into stocks for the sake of being fully invested or to “participate” in the stock market, sacrificing on quality or valuations. Don’t dance, invest. Look at your portfolio and ask yourself a question: “If I didn’t know what the Dow is doing today, would I still want to own these stocks?” If after re-examining your portfolio you find that you own a lot of overvalued stocks, do the painful but correct thing – sell.
I promise you it will be a very painful decision, because those stocks will go higher … until they don’t. Cash is a four-letter word today because it earns nothing (thanks to the Fed) and because it drags down the returns of your portfolio in an appreciating market; but cash is king when no one else has enough of it and when investors who could not get enough of stocks are stampeding for the exits.
Footnote: Revisionist’s Earnings
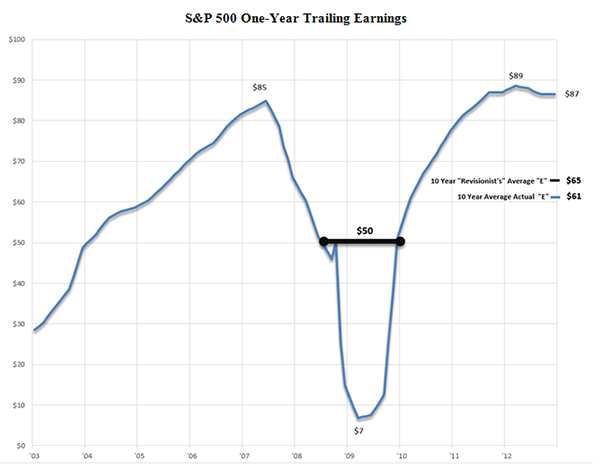
The best way to normalize earnings for short-term profit-margin volatility is to compute 10-year trailing earnings for the S&P 500 and compare them to the average 10-year trailing P/E, which over the last 100-plus years was at about 18. This approach does a great job of normalizing earnings for profit-margin volatility, except when your look-back time period includes the recent Great Recession, when S&P 500 earnings collapsed from $85 to $7. You can argue that the $85 number in 2007 was inflated by exuberant earnings in financial stocks, and you’d be right, but it is also important to remember that in first quarter of 2009 AIG suffered the largest loss in corporate history, $61.7 billion. 2009 was not a great vintage year for Citi, Bank of America, and others, either.
Since the Great Recession distorts earnings power of the S&P 500, I decided to normalize it. I went back and revised history: I turned the mother of all recessions into a garden-variety one. I assumed that earnings had bottomed at $50 a share (see chart below) – a nice round number, a decline of 41% from their peak. (During the 2001 recession S&P 500 earnings declined from $53 to $25, a 54% decline.) Then I computed the “revised history” 10-year trailing “E”, and to my mild surprise, “E” went up only $4, from $61 to $65. In other words, the average stock was trading not at 26 times but at 25 times 10-year trailing earnings, and not at 41% above average valuations but only at 38%.





0 comments